The good news in 2025 was that the industry saw a 24-cent increase in basket value versus 2024, according to the NACS State of the Industry Report® of 2025 Data. The not-so-good news was that the average inside transactions per store, per month declined 1.6% year over year.
Ultimately, the rising cost of goods sold and higher operating expenses outpaced in-store gross profit growth. And although the c-store industry saw record in-store sales in 2025 of $341.2 billion, the 1.7% year-over-year increase was the lowest since 2020. These numbers underscore the continued pressure that retailers face to boost in-store traffic, grow sales and protect margins in an increasingly challenging operating environment.
At the NACS State of the Industry Summit in April, the message shared with retailers was to focus on in-store transaction counts and growing basket value. “If you’re not actively strategizing around traffic, you’re leaving your future to chance,” said Chris Rapanick, managing director of NACS research.
Rapanick also noted that retailers don’t need to boil the ocean to build basket value—small changes can add up. “Think about your store teams upselling and running effective promotions. Basket profitability is a game of pennies, where adding one item to a basket can turn a loss into profit,” he said.
Impact of Global Uncertainty
Over a decade of NACS consumer surveys consistently show that economic uncertainty affects consumer sentiment, where high gas prices, inflation, recessions and global pandemics all play a role in discretionary spending at retail.
For the second and third quarters of 2026, the cost of crude and gas prices remained elevated throughout the summer travel season with no clear end in sight as of this writing. And the U.S. Energy Information Administration has estimated that it could take until early 2027 before crude oil production and trade patterns return to where they were before the conflict with Iran.
This year, c-stores have felt the impact of economic and geopolitical forces beyond their control. When fuel gallons and pump transactions are down, in-store spending can often suffer. Center store snacking categories like salty and alternative snacks are bellwethers for consumer mindset: Are people buying little treats or are they cutting back on discretionary spending?
First Six Months Outlook
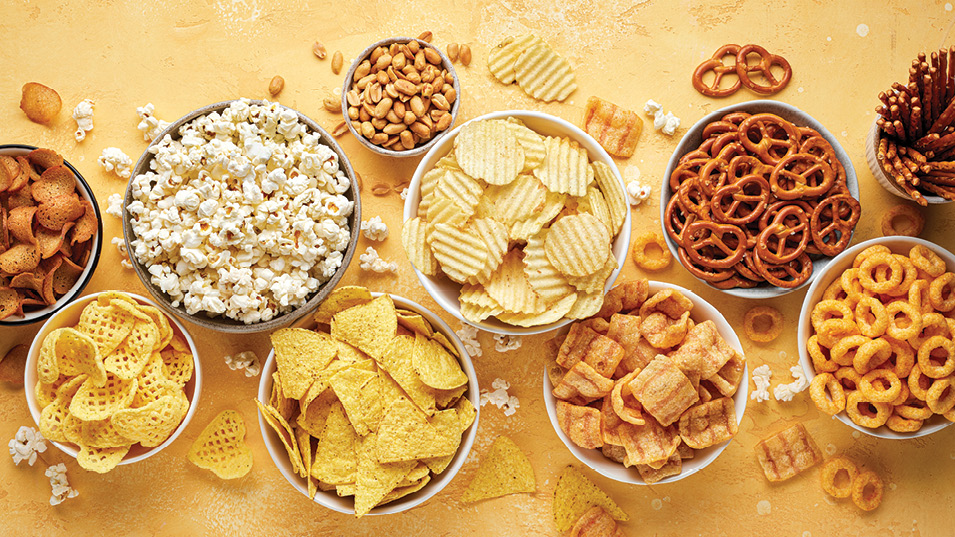
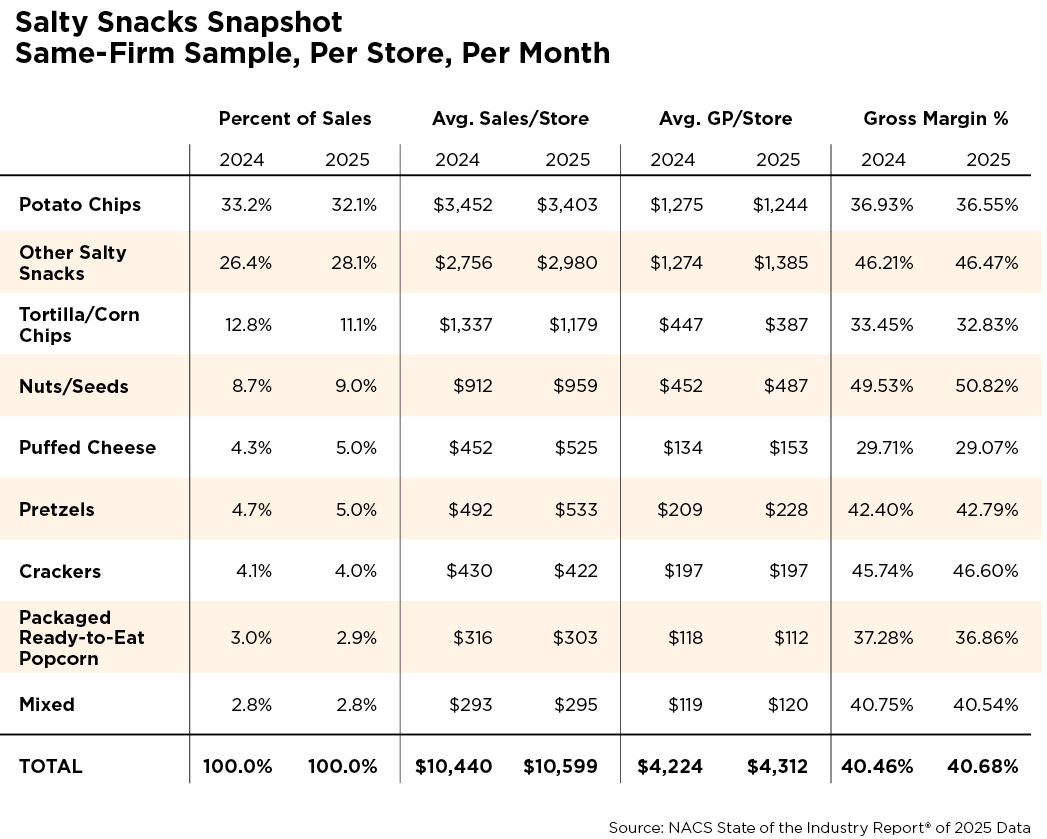
Unit decline in the salty snacks category has been a continuation of 2024 (-5.5%) and 2025 (-4.8%), according to NielsenIQ (NIQ) data. From January through June of this year, units for the category were down 4.5%.
Sales and gross profit dollars are also falling for the salty snacks category this year. They are down 11.5% and 8.7%, respectively, compared to the first half of 2025, according to NACS CSX data.
The salty snacks subcategory that performed well, with increases of 1.1% for sales and 1.9% for gross profit dollars, was mixed, which includes pre-mixed assortments of other salty snack subcategories sold in a single package.
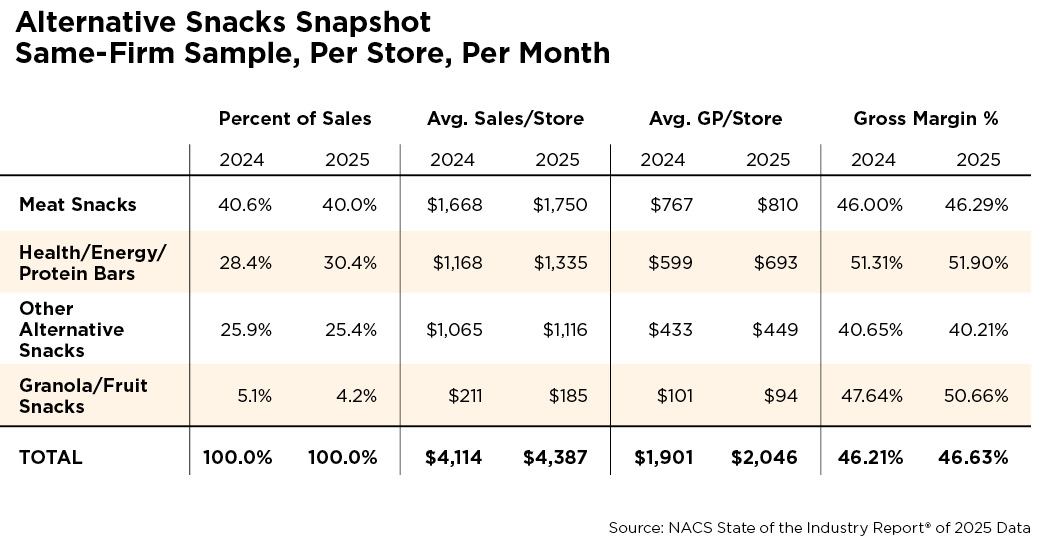
In the alternative snacks category, which has become synonymous with protein and better-for-you options, the story was similar: Units were down for the year and sales were down 1.8% from January to June 2026 compared to the same period in 2025.
While sales for each of the alternative snack subcategories were down, health, energy and protein bars fared the best of the bunch, down 0.3%, per NACS CSX data—it was the only subcategory that showed positive gross profit dollar growth (1.1%).
Granola and fruit snacks took the biggest hit, down 16.7% in sales. Sales for meat snacks, the alternative snacks category leader, were down 2.0%.
When to Snack?
According to PDI Insights Cloud data from July 2025 to July 2026, transaction counts for the salty and alternative snacks categories were down 2.7% and 5.8%, respectively, while the average dollar amounts per transaction were up 0.8% and 2.9%.
PDI heat map data shows that the afternoon is the most popular time of day for salty snacks sales, with Friday being the most popular day for purchases. There is a slight uptick at midday, suggesting that customers purchase salty snacks with lunch, or possibly as a meal replacement.
For alternative snacks, PDI heatmap data shows that sales are popular during the morning (7-8 a.m.) and the afternoon (3-5 p.m.)—combined, these hours account for nearly 27% of category sales throughout the week. Thursdays and Fridays are the most popular days of the week for alternative snacks during the morning and afternoon dayparts.
Similarly to salty snacks, lunchtime also sees an uptick in alternative snacks sales and likely for similar reasons: to accompany a meal or serve as a meal replacement.
Trip Driver and Basket Builder
NIQ data showed that in 2025, there were 258 new salty snacks items introduced to the c-store channel.
The 2025 NACS Convenience Voices study found that shoppers who purchase salty snacks are likely to consume what they bought immediately or within one to two hours of purchase. Looking at the customers’ path to purchase, most typically make their decision to purchase a salty snack item while driving to the store.
The Convenience Voices study also notes that salty snacks have high promotional engagement: 47.1% of salty snack shoppers noticed a promotion in the store, while 31.9% purchased an item that was on promotion.
The State of Snacking
The 2026 State of Snacking report—a collaboration between Mondelēz International, Mintel and Black Swan Data—reveals a global consumer landscape where snacking has evolved beyond an in-between-meals occasion.
According to the report, 66% of adults in the U.S. snack at least once a day, 26% snack twice a day, 23% snack once a day and 17% snack three times a day or more.
The study also found that nostalgia can be a draw: 52% of U.S. adults who eat salty snacks prefer products with nostalgic marketing or packaging styles and 46% of U.S. adults who buy snack, nutrition or performance bars prefer products with nostalgic marketing or packaging styles. Many of these consumers (69%) also agree that a bar can be a good replacement for a meal.
And when it comes to bars specifically, 41% of U.S. consumers who buy these items purchase them for the high protein content, and 32% because of high fiber content.
More and more, snacking isn’t being perceived as an indulgent occasion. According to the report, 43% of U.S. adults who eat salty snacks agree that with the right ingredients, salty snacks can be healthy.
Meanwhile, what consumers say they want doesn’t always match what they do. There is interest in purchasing items perceived as healthier options, but that’s not always the motivational factor. “To eat healthier” and “To get more protein or fiber” sit at the bottom of the report’s motivational list, while the top two motivations are “Because I’m hungry” and “To treat myself.”
What Does the Future Hold?
By mid-August, NACS CSX data showed signs that the industry was bouncing back from lower fuel volume throughout the summer with an uptick in fuel gallons sold. This is positive news for inside sales, even though the average price per gallon was about a dollar more than a year ago.
The message to retailers today is no different than it was in April: Building basket value doesn’t come from sweeping changes or expensive remodels—it comes from adding one item to every basket.